Understanding mobility
Education is often seen as the great equalizer, and for good reason. College graduates earn 62% more in annual wages on average, and nearly a million dollars more over their lifetime than those with only a high school education (Alleman et al., 2008). With this in mind, it is important to know which colleges are consistently able to allow a student from a low-income family to move to a higher socioeconomic status post-graduation. This is referred to as social mobility.
Social mobility is not a simple metric to measure. The average mobility rate in the nation is 1.7% of people moving from the bottom income quintile to the top income quintile. For context, a society with perfect social mobility would be at 4% (Chetty et al., 2017). Each college’s mobility rate is the product of its access rate, the fraction of its students who come from families in the bottom 20% of the income distribution, and its success rate, the fraction of those students who reach the top fifth.
Social mobility is not a simple metric to measure. The average mobility rate in the nation is 1.7% of people moving from the bottom income quintile to the top income quintile. For context, a society with perfect social mobility would be at 4% (Chetty et al., 2017). Each college’s mobility rate is the product of its access rate, the fraction of its students who come from families in the bottom 20% of the income distribution, and its success rate, the fraction of those students who reach the top fifth.
|
Access rates and success rates are important, but can be misleading when considered individually. For example, Washington & Lee University has a high success rate of 51%, but the university enrolls more students from the top 1% than the entire bottom 60% of the income distribution. Only 1.1% of their students are from low-income families, and their mobility rate is the lowest in the state at 0.6% because of their low access rate. (Chetty et al., 2017).
|
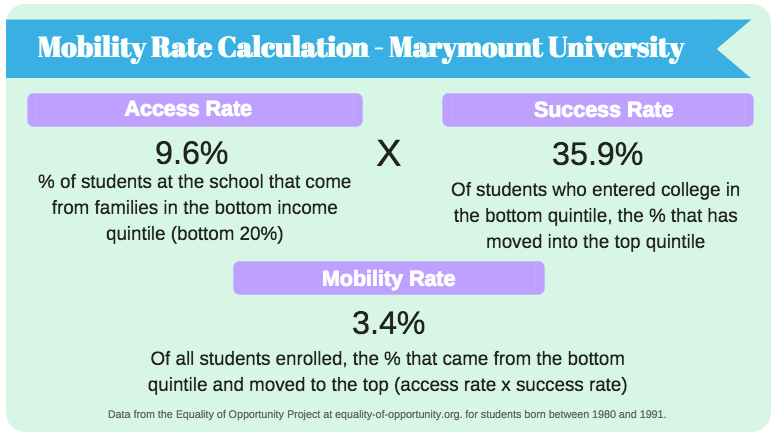
Marymount University is tied for the highest mobility rate in the state, well above the average for colleges.
|
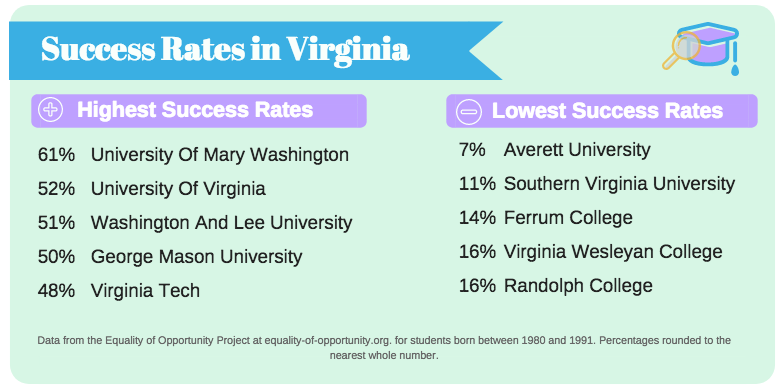
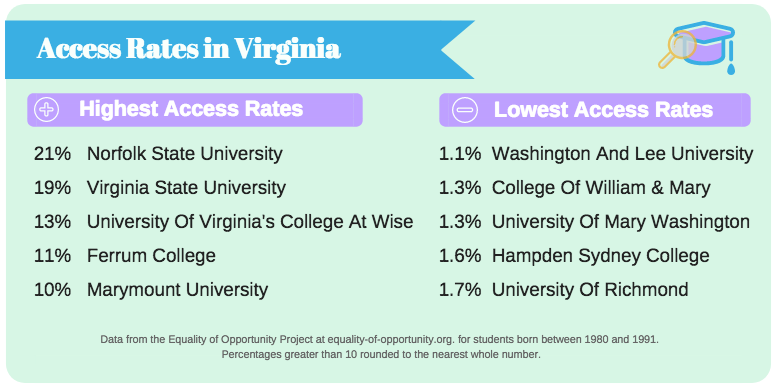
The images below give a quick look at the colleges with the highest and lowest success and access rates. As you can see, some of the colleges with the highest success rates remain relatively inaccessible to low-income students, with less than 2% of their population being of the bottom 20% of the income distribution.
|
|
For the purpose of this project, four-year public and private not-for-profit institutions in the state of Virginia were analyzed. That being said, community colleges and for-profit institutions serve a large number of college students, especially those coming from lower income families. To learn more about how community colleges or for-profit institutions are serving low income students nationwide, please refer to resources from the Equality of Opportunity Project or the Department of Education's College Scorecard. In addition, the New York Times Upshot created a great interactive tool to visualize college mobility.
Access and Mobility by College Institution
Compiled from data from the Equality of Opportunity Project (2017) as well as the Department of Education's College Scorecard (2017), the pictures below provide at-a-glance views of access and mobility at specific four-year institutions in the state.
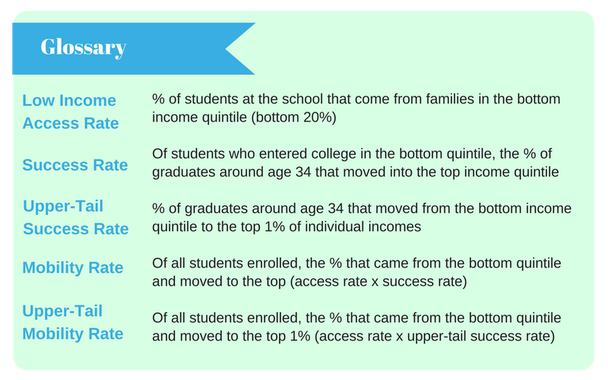
To the right is a glossary of the terminology used and what each measure indicates. Below are institution highlights that show five different rankings in order to provide a comprehensive snapshot of how each college serves, or does not serve, low-income students.
To the right is a glossary of the terminology used and what each measure indicates. Below are institution highlights that show five different rankings in order to provide a comprehensive snapshot of how each college serves, or does not serve, low-income students.
While this information provides useful snapshots of college access and outcomes, it is important to note that these statistics are not meant to be a ranking of the 'best' and 'worst' colleges. They also do not take into account a large number of reasons that might make a student eager to attend a specific college. Campus culture, course offerings, proximity to home, name value, tuition discount rate, scholarships, extracurriculars, and many more factors are involved in college choice. College "fit" is an important consideration. While success rates may be higher at certain institutions, this does not mean that every student will be more successful there.
